 |
| We will
start this Editorial section by taking a look at what TTI (the creators
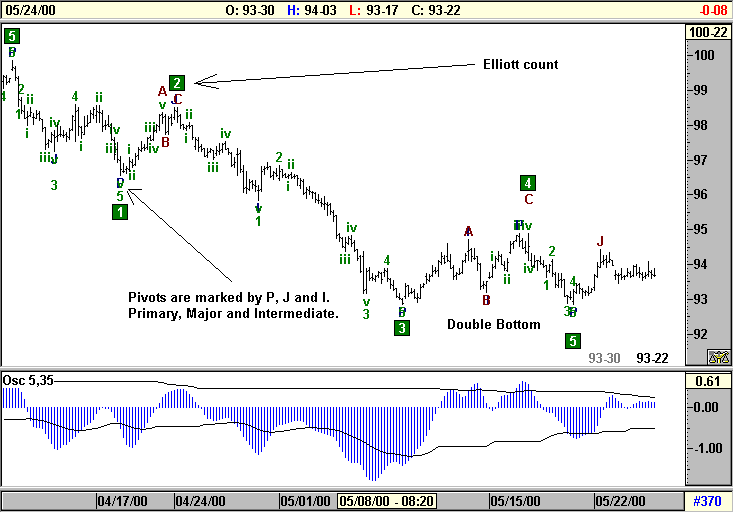
of Advanced GET) call the 'Type 1' trade. The chart shown above is a
60-minute
full Elliott sequence down in Treasury Bonds, 30-Year US. The Type 1
trade
is quite simply, entering the trade short (in this case) at the end of
wave 4 to trade the wave 5 down. We will cover trading wave 3’s in
another
Editorial.
Looking
at the chart above, you should have noted that it is a double bottom.
In
terms of an example this is good as it allows me to demonstrate how
trades
can full short of our expectations and why I believe it is so important
to trade with two positions, short-term (ST) and long-term (LT). I
think
this procedure can make the difference between winning and losing
overall.
I will explain why further into the Editorial.
For
now there are a couple of points I wish to explain concerning the chart
above. First, there is the Elliott Count. An Elliott Count is a guide
to where the market may be at any given moment. Note, I use the
words ‘guide’ and ‘may’. The reason for this is: there is no such thing
as a hard and fast count; counts will be validated or invalidated as
the
market progress.
In
fact, you could put three or so Elliott traders in a room, give them
the
same chart, and each would give you a different count! These counts may
range from usable, to ludicrous. This is why Advanced GET has been
programmed
with a totally objective Elliott Wave count. Evan then, steps have to
be
taken to verify that the count given by the software is fit to trade.
The
other thing I’d like you to note at this stage are the Pivot points on
the chart. These are labeled P (primary), J (major) and I
(intermediate).
The labels are slightly obscured by the Elliott count, but the count
can
be turned on and off at the touch of a mouse button if this is ever a
problem.
The important thing to note is that these are important points from
witch
we can use our drawing tools. You will see this as we progress.
|
 |
| Trading
technical analysis is all about probabilities. You will see that I have
analysed a lot of information on this chart. Some traders prefer to
keep
thing more simple. This - in the majority of cases – means they don’t
look
so deep. It is a matter of ones style, and this only develops with
experience.
My point here is that the more concurrences that appear to come
together
at any one time and price improve your perception of the probabilities
of your success with any given trade. However you trade, you must trade
with confidence!
The amount
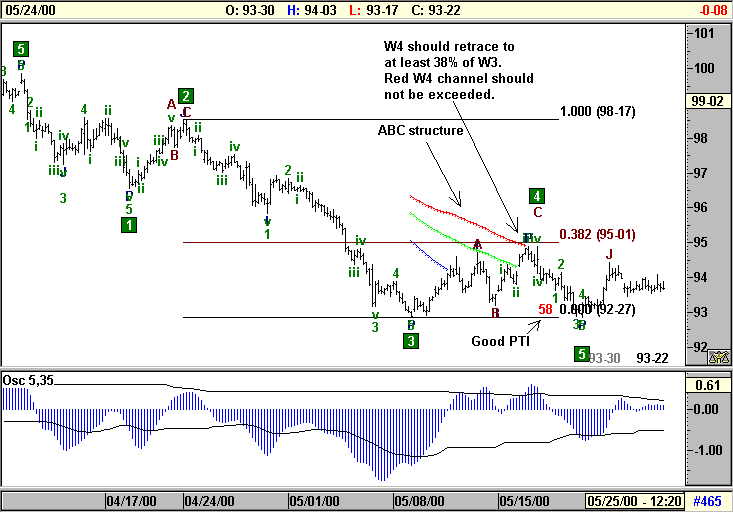
a wave 4 can retrace, and the presents of an ABC correction within the
wave 4 varies from sequence to sequence. So we need a practical rule
here
to keep us from entering the trade too soon. In general, a wave 4 will
retrace wave 3 by one of three ratios. Either 38% or 50% are most
common.
The other ratio is 61.8%, but this is more common in Elliott sequences
that become invalidated, and thus lose us money when traded.
If
the Wave 4 termination is less than 38% and meets with an Ellipse, at
the
same time that the 5,35 Oscillator retraces to zero (more on next
page),
then this is also expectable. (There is no Ellipse in this case.) This
tends to happen when wave 4 is a longer sideways movement. The wave 4
should
not retrace past the wave 4 channels shown in the chart above. If this
happens, the odds decrease for a good wave 5, and again, you are more
likely
to end up losing the trade. The PTI figure needs to be 35 or greater.
Again,
this is a measure of the probability for a good wave 5. .
|
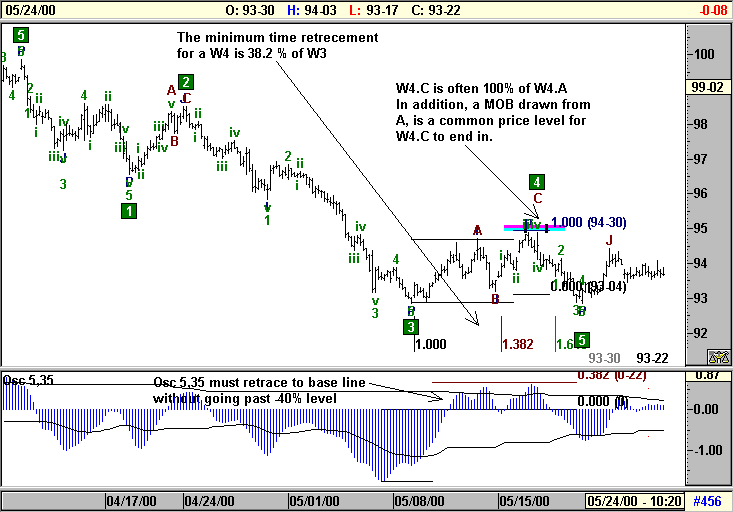 |
| At the
time we have decided that this may be a high probability place for a
wave
4 to terminate at, the 5,35 Oscillator should retrace to zero (the base
line)
without moving beyond 40% of the wave 3 Oscillator height, projected
(in
this case) up from the base line. If this point is broken, one must
move
to the next Oscillator out (10,70) and use that to assess if wave 4
could
have ended.
Once
again, the Oscillator should retrace to zero without taking out the 40%
level. I often refer to this as the –40% level, as it is on the other
side
of the base line to the wave 3 peak.
There
are a couple more price termination checks we can perform. W4.C will
often
be equal to either a 61.8% or 100% or 162% of W4.a. This is shown on
the
chart where W4.C = 100% of W4.A. The other is to draw a MOB from W4.A.
In most cases this will catch the W4.C termination.
Time
is also another important consideration in trading, although this tends
to be less precise when compared with price. The best tool I’ve ever
seen
for accurately predicting price is Advanced GET’s Ellipse. But as
stated,
there is no Ellipse here. Regardless of the Ellipse, the minimum time
for
a wave 4 retracement to complete is 38.2% of wave 3. The typical amount
is between wave 38.2% and 61.8%. Past this, again things become less
predictable.
|
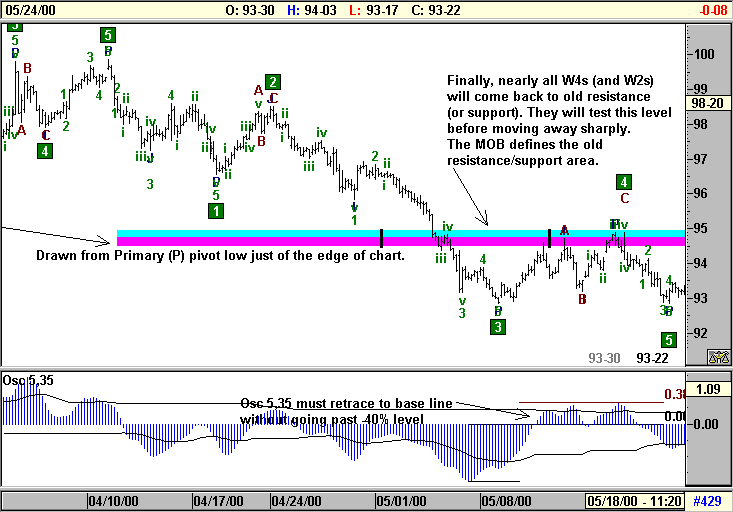 |
Finally,
in the analysis process, and this is one of the observations I have
grown
fond of, is the fact that retracements will nearly always end at an old
support/resistance level. The level concerned on our Bonds chart is
shown
by the big MOB above. This MOB was first support, but once the market
gained
enough downward momentum to get past it, the MOB became a resistance
level.
This is such an important principle in technical analysis: old support
becomes new resistance and visa-versa. If you take a look in the
‘Markets’
section, just make an observation of how many wave 2s and wave 4s end
in
old support/resistance levels. When this is not a MOB, I tend to show
it
as a thick grey line that can be followed back towards the left where
support
or resistance can clearly be seen in the chart it’s self. For example,
a pivot low is support. Something stopped the market there; made it
tern
around and go back up. These levels stick in trader’s minds and the
trading
collective will tend to pay a lot of attention to their actions when
the
market is near to them.
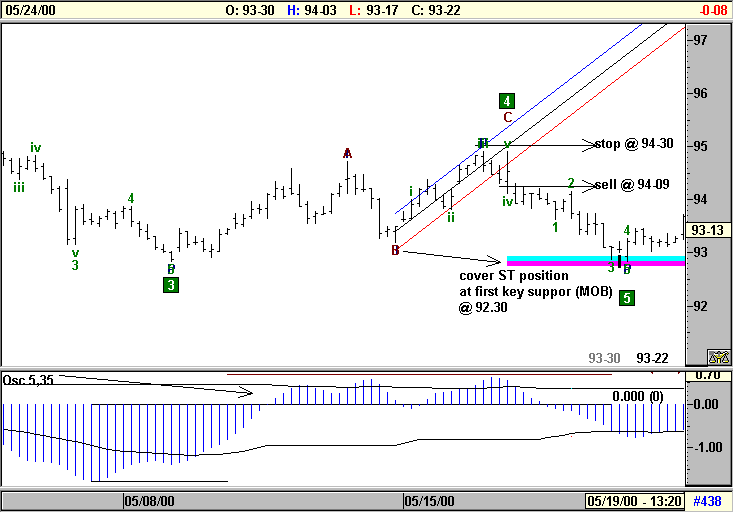
When
the analysis is complete, the next step is to place the trade. This is
where I will reiterate the importance of trading sort-term (ST) and
long-term
(LT) positions. When the trade is placed, both ST and LT stop-losses
are
placed a couple of ticks above wave 4 @ 94-30. A trend-channel drawn on
the last slop of the wave 4 (the C slop) is used to enter the trade.
The
entry is simple and totally mechanical. Wait for a Close outside of the
trend-channel. Once this bar is complete with a close outside, place a
stop in the market one tick below the low of the bar that closed
outside
of the trend-channel to enter the trade. The price the entry stop is
placed
at in this trade is 94-09; this is an entry for both ST and LT
positions.
Your risk is the difference between the entry and stop-loss; here, this
is 21 ticks. This is a dollar amount of $656.25 per contract, or
$328.02
per MIDAM contract.
When
this level is penetrated, you are automatically placed in the trade.
The
MOB shown on the chart above shows the first resistance area that
presents
a fret to the progression of our trade. When the market is nearing it
we
want to move our ST stop-loss into the profit side of our entry, but
keep
it away from the price action by placing it a tick or two above a high
several bars back from the current at that time. This would be at
around
93-20. Depending on ones trading style, the LT position stop-loss can
be
moved to break-even, 94-09, or left at 94-30. Once the market hits the
MOB, support is expected, so one covers the ST position to maximise its
profit. Do not forget to cancel the ST stop-loss at this time. This
occurs
at around 92-30. We have now put some money in the bank (around $1343
per
contract) and we can try and take advantage of any further movement
down
with the LT position.
This
is not guaranteed, and in order to allow for the market to go down
further,
we also have to keep the LT stop-loss wound back allowing the market to
move back up some without being stopped out. The market in all
likelihood
will move up again in reaction to the resistance depicted by the MOB,
before
moving back down further. This is why two positions is best; as seen in
this chart, first resistance has the market running sideways to
up.
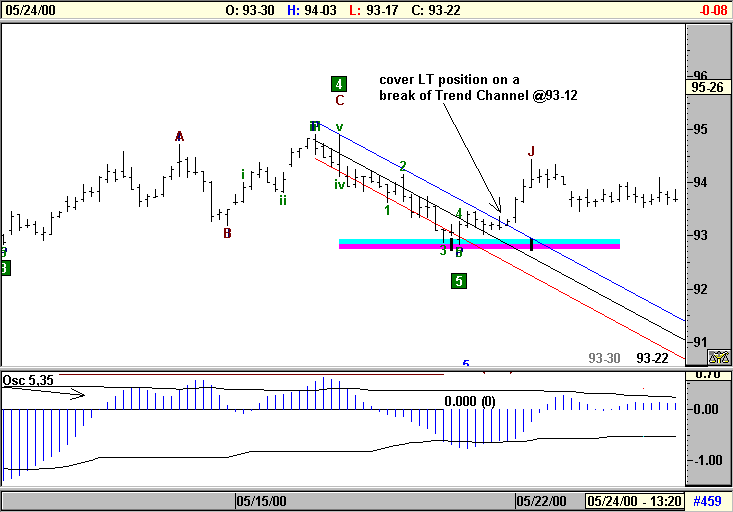
It is
only when first resistance is archived and the market begins to move
again
towards the downside, that a sensible trend channel can be dawn to
contain
the wave 5. This trend channel is used to exit the LT position when the
market breaks the upper channel (blue).
Now this,
being a double low, is a good example of trading two positions. Note I
say positions not contracts. Each position can be a number of contracts
depending on the amount of capital one has to trade with. I know this
is
obvious to most, but I have to cater for those who are new to trading
as
well.
The market
breaks the trend-channel at around 93-12. This is where we cover the
long-term
position, netting a further $437 dollars per contract. Note we made
less
with the LT position, not more! This is the advantage of trading ST and
LT positions, as trying to allow for resistance and new lows with one
position
can make the whole trade a break-even trade, or worse still a loss. I
hope
you have enjoyed this first editorial. Good
Trading
Derek
Pell
UK
– Advanced GET Rep.
Day Traders should look at Advanced GET- The
Premier Technical
Analysis Software Package to maximise profits and minimise losses
whilst
trading from Sirius Traders. Click below for details:
|
|




 CONTACT
US CLICK


